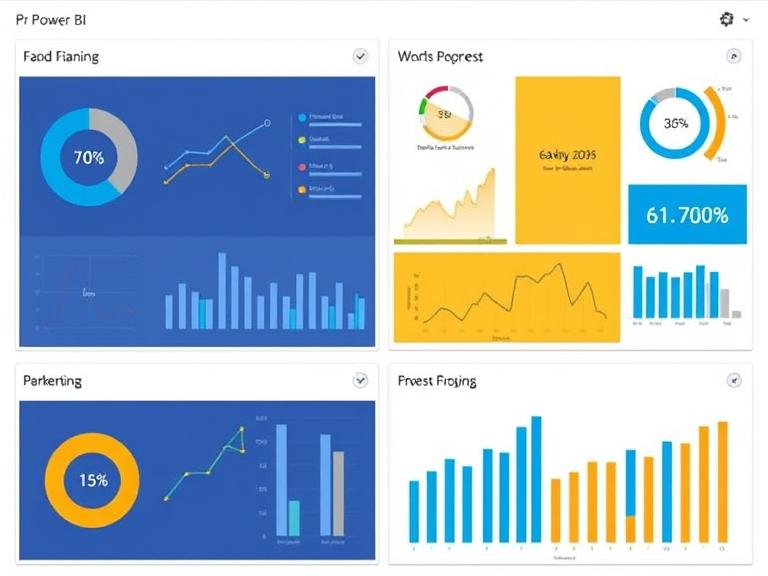
Power BI is Microsoft’s interactive data visualization and business intelligence platform. It enables users to connect to various data sources, create dashboards, and generate insightful reports—all with minimal coding.
Why Power BI is popular:
- Seamless integration with Microsoft products (Excel, Azure, SQL Server).
- Intuitive drag-and-drop interface.
- Real-time dashboards with automatic data refresh.
- DAX (Data Analysis Expressions) for advanced calculations.
Power BI components:
- Power BI Desktop: Desktop application for creating reports.
- Power BI Service: Cloud-based platform for sharing and collaboration.
- Power BI Mobile: Access dashboards on the go.
- Power Query: ETL tool for data preparation and transformation.
Key capabilities:
- Connect to diverse data sources: Excel, SharePoint, APIs, databases, cloud services.
- Visualize data through charts, maps, KPIs, and custom visuals.
- Build interactive dashboards with slicers, filters, and drilldowns.
- Schedule data refreshes and share reports with role-based access.
Use cases range from executive dashboards and sales performance tracking to customer segmentation and financial forecasting.
Power BI empowers businesses to make data-driven decisions quickly and visually. For analysts, managers, and decision-makers, learning Power BI is a strategic advantage in the era of real-time intelligence.
Leave a Reply